
OBSERVER: C3S Weather Replay App lets users explore historical weather conditions
Recent intense wildfires, record-breaking heatwaves in Europe, and high temperatures during the 2026 FIFA World Cup have drawn attention to the effects of extreme heat on public health and major sporting events. They have also increased interest beyond the climate and weather community in understanding how weather conditions have developed over time and how recent events compare with those of the past. The new Weather Replay App, from the Copernicus Climate Change Service (C3S), makes more than 80 years of historical weather data easier to explore for researchers, educators, students, public authorities, and members of the public. The app enables users to replay and compare past weather for selected dates, including historical events such as D-Day. In this Observer, we examine how the Weather Replay App works and use concrete examples from recent wildfires, heatwaves, and World Cup matches to show how users can explore past weather conditions.
What was the weather like during previous World Cup tournaments, or when Apollo 11 launched in July 1969? The Weather Replay App allows users to investigate such questions directly. Users can review hourly weather conditions anywhere in the world from January 1940 to a few days before the present. Previously, answering these questions often required searches through newspaper archives and difficult-to-access meteorological records. The app draws on ERA5, the fifth-generation reanalysis dataset produced by the European Centre for Medium-Range Weather Forecasts (ECMWF), to present eight decades of historical weather data interactively.
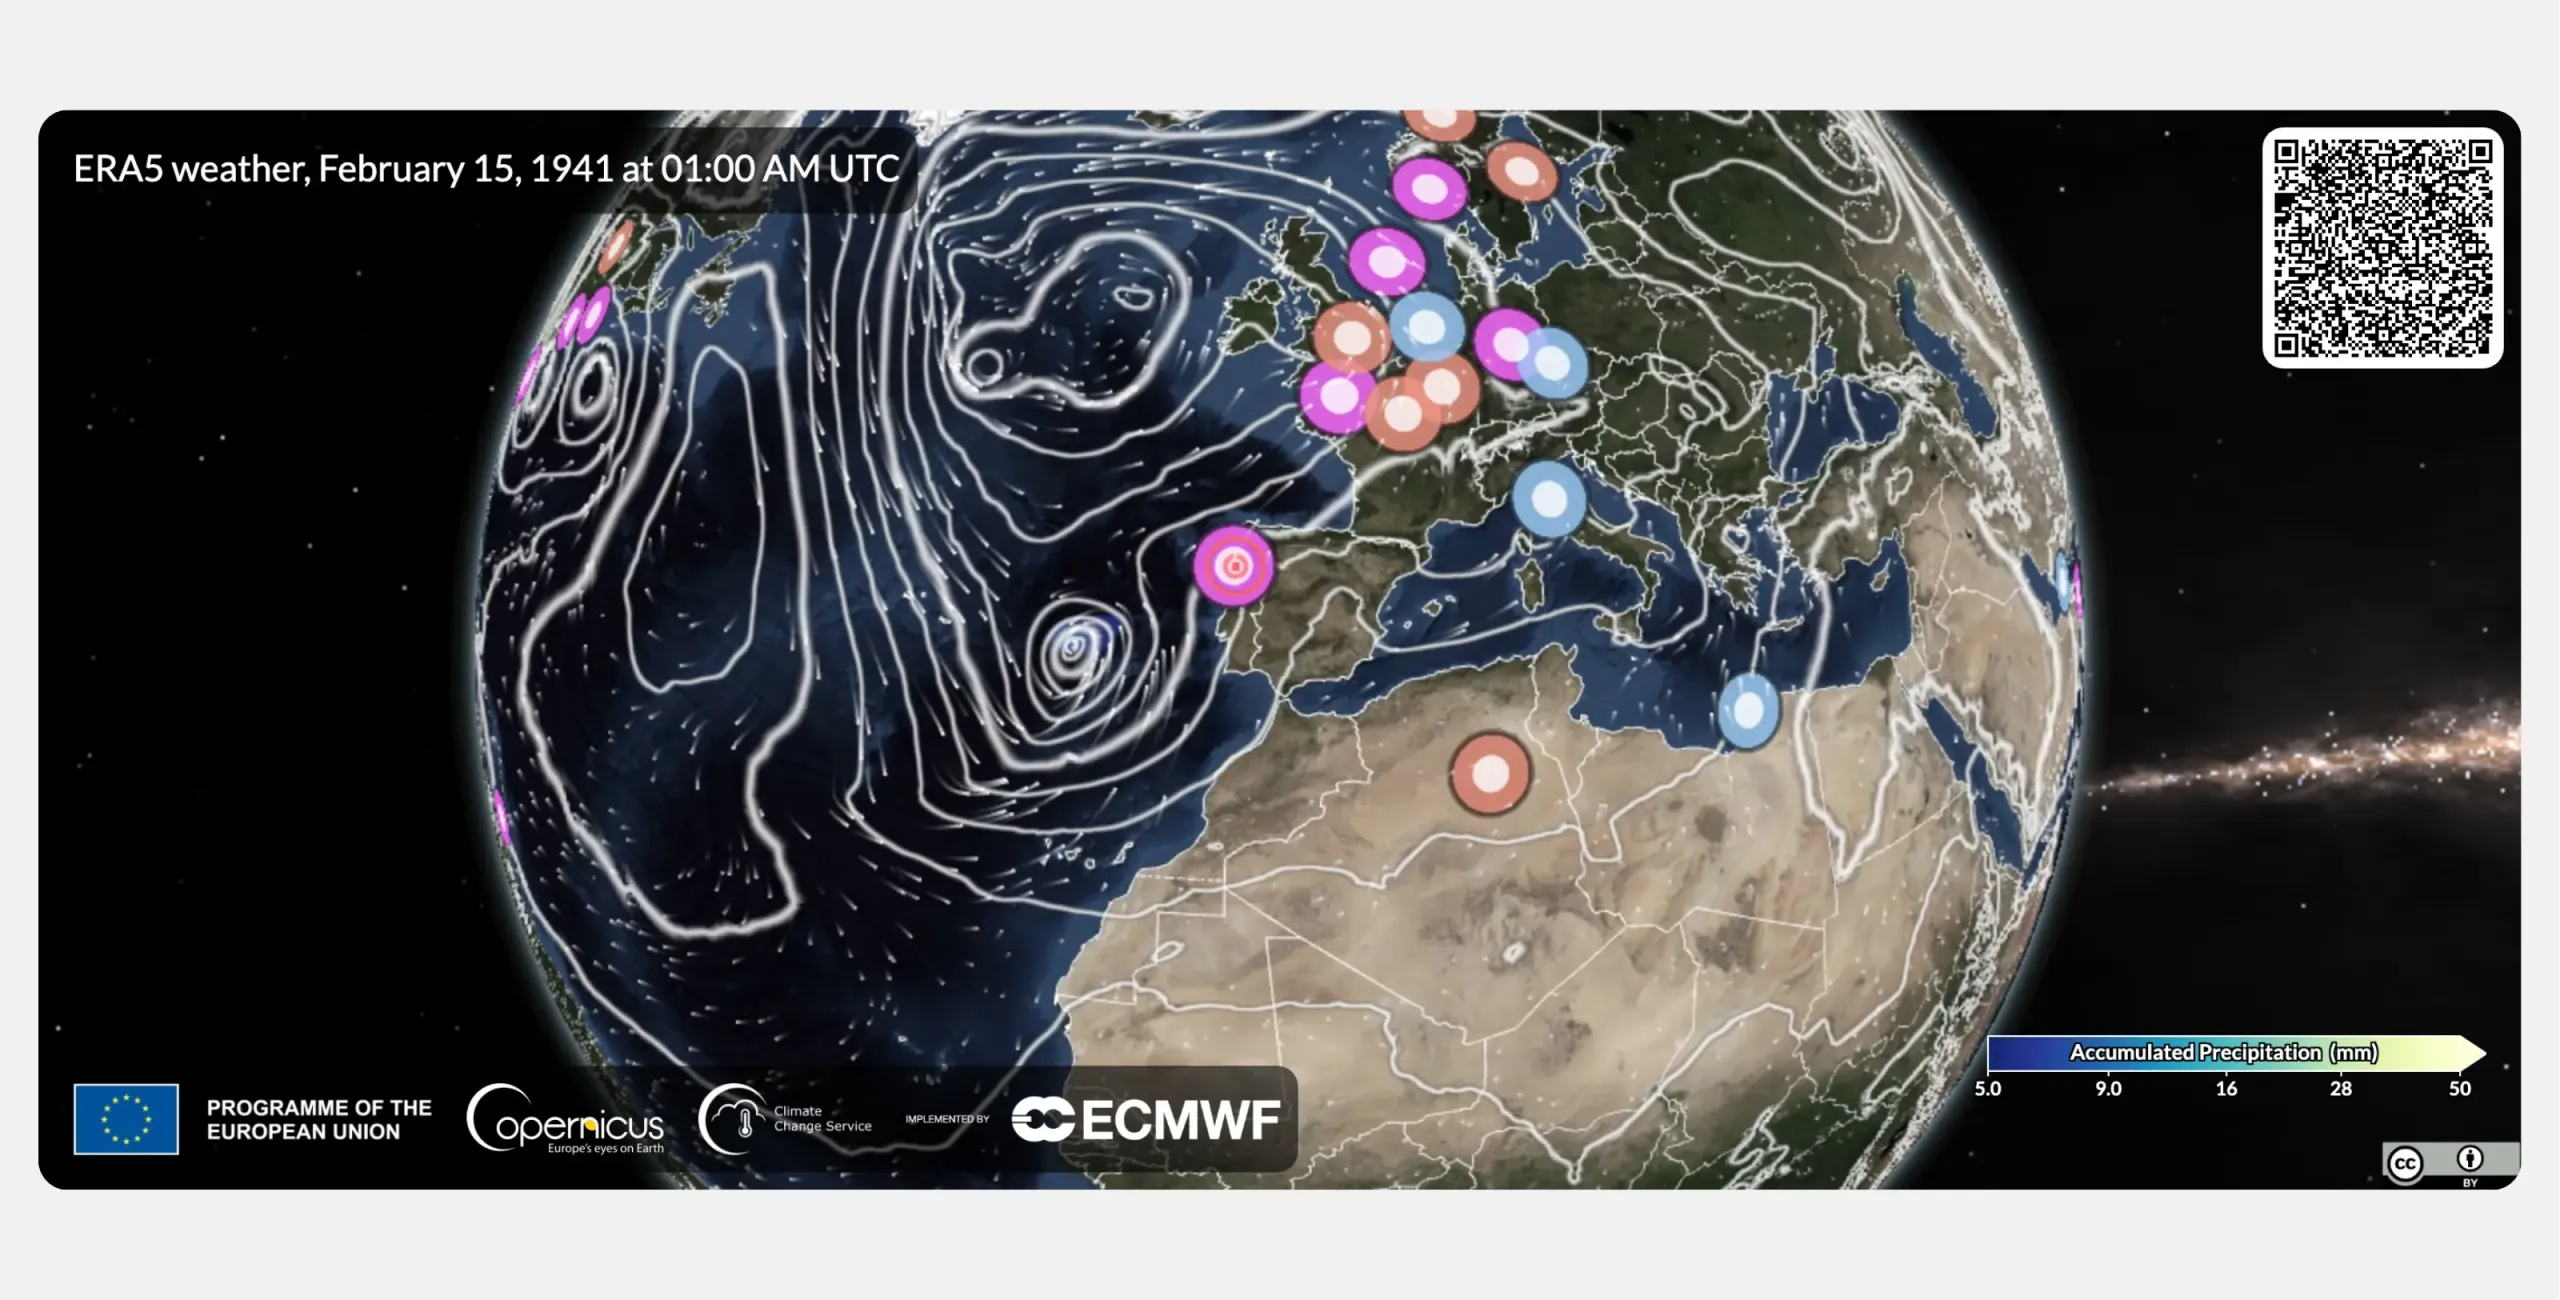
Users can select key variables through the Layers button, including temperature, precipitation, wind speed and gusts, and pressure. The app visualises how conditions evolved during events such as wildfires, heatwaves, floods, hurricanes, and cyclones. For example, the app can display the weather conditions surrounding the suspension of recent World Cup matches in Philadelphia, United States, including the France–Iraq match. The tool also displays a set of upper air variables, which can help provide context for the atmospheric conditions associated with the weather experienced at the surface. Selected views can then be shared through the ‘share’ function, and data can be exported for further analysis.
The app provides an interactive tutorial which introduces its main functions and a selection of historical events to help users get started, including Hurricane Katrina, the 2003 European heatwave, and Cyclone Nargis, which affected Myanmar in 2008. The app can also be used to revisit the weather on personally significant dates, such as weddings and birthdays.
Extreme heat: comparing recent and historical conditions
Between 21 and 30 May 2026, Europe was affected by an unusually early and intense heatwave. Daily average temperatures in western France, England, and Wales reached more than 10°C above average. Numerous national and local records were reportedly broken, with Portugal and the UK recording their highest May temperatures. Western Europe was then struck by three more heatwaves across the next two months, leading to the region experiencing its hottest June-July period on record. That extreme heat, combined with prolonged dry conditions led to the spread and intensification of extreme wildfires, especially in France and Spain, where blazes led to several deaths and unprecedented evacuations as nearly 400,000 sought refuge from the flames.
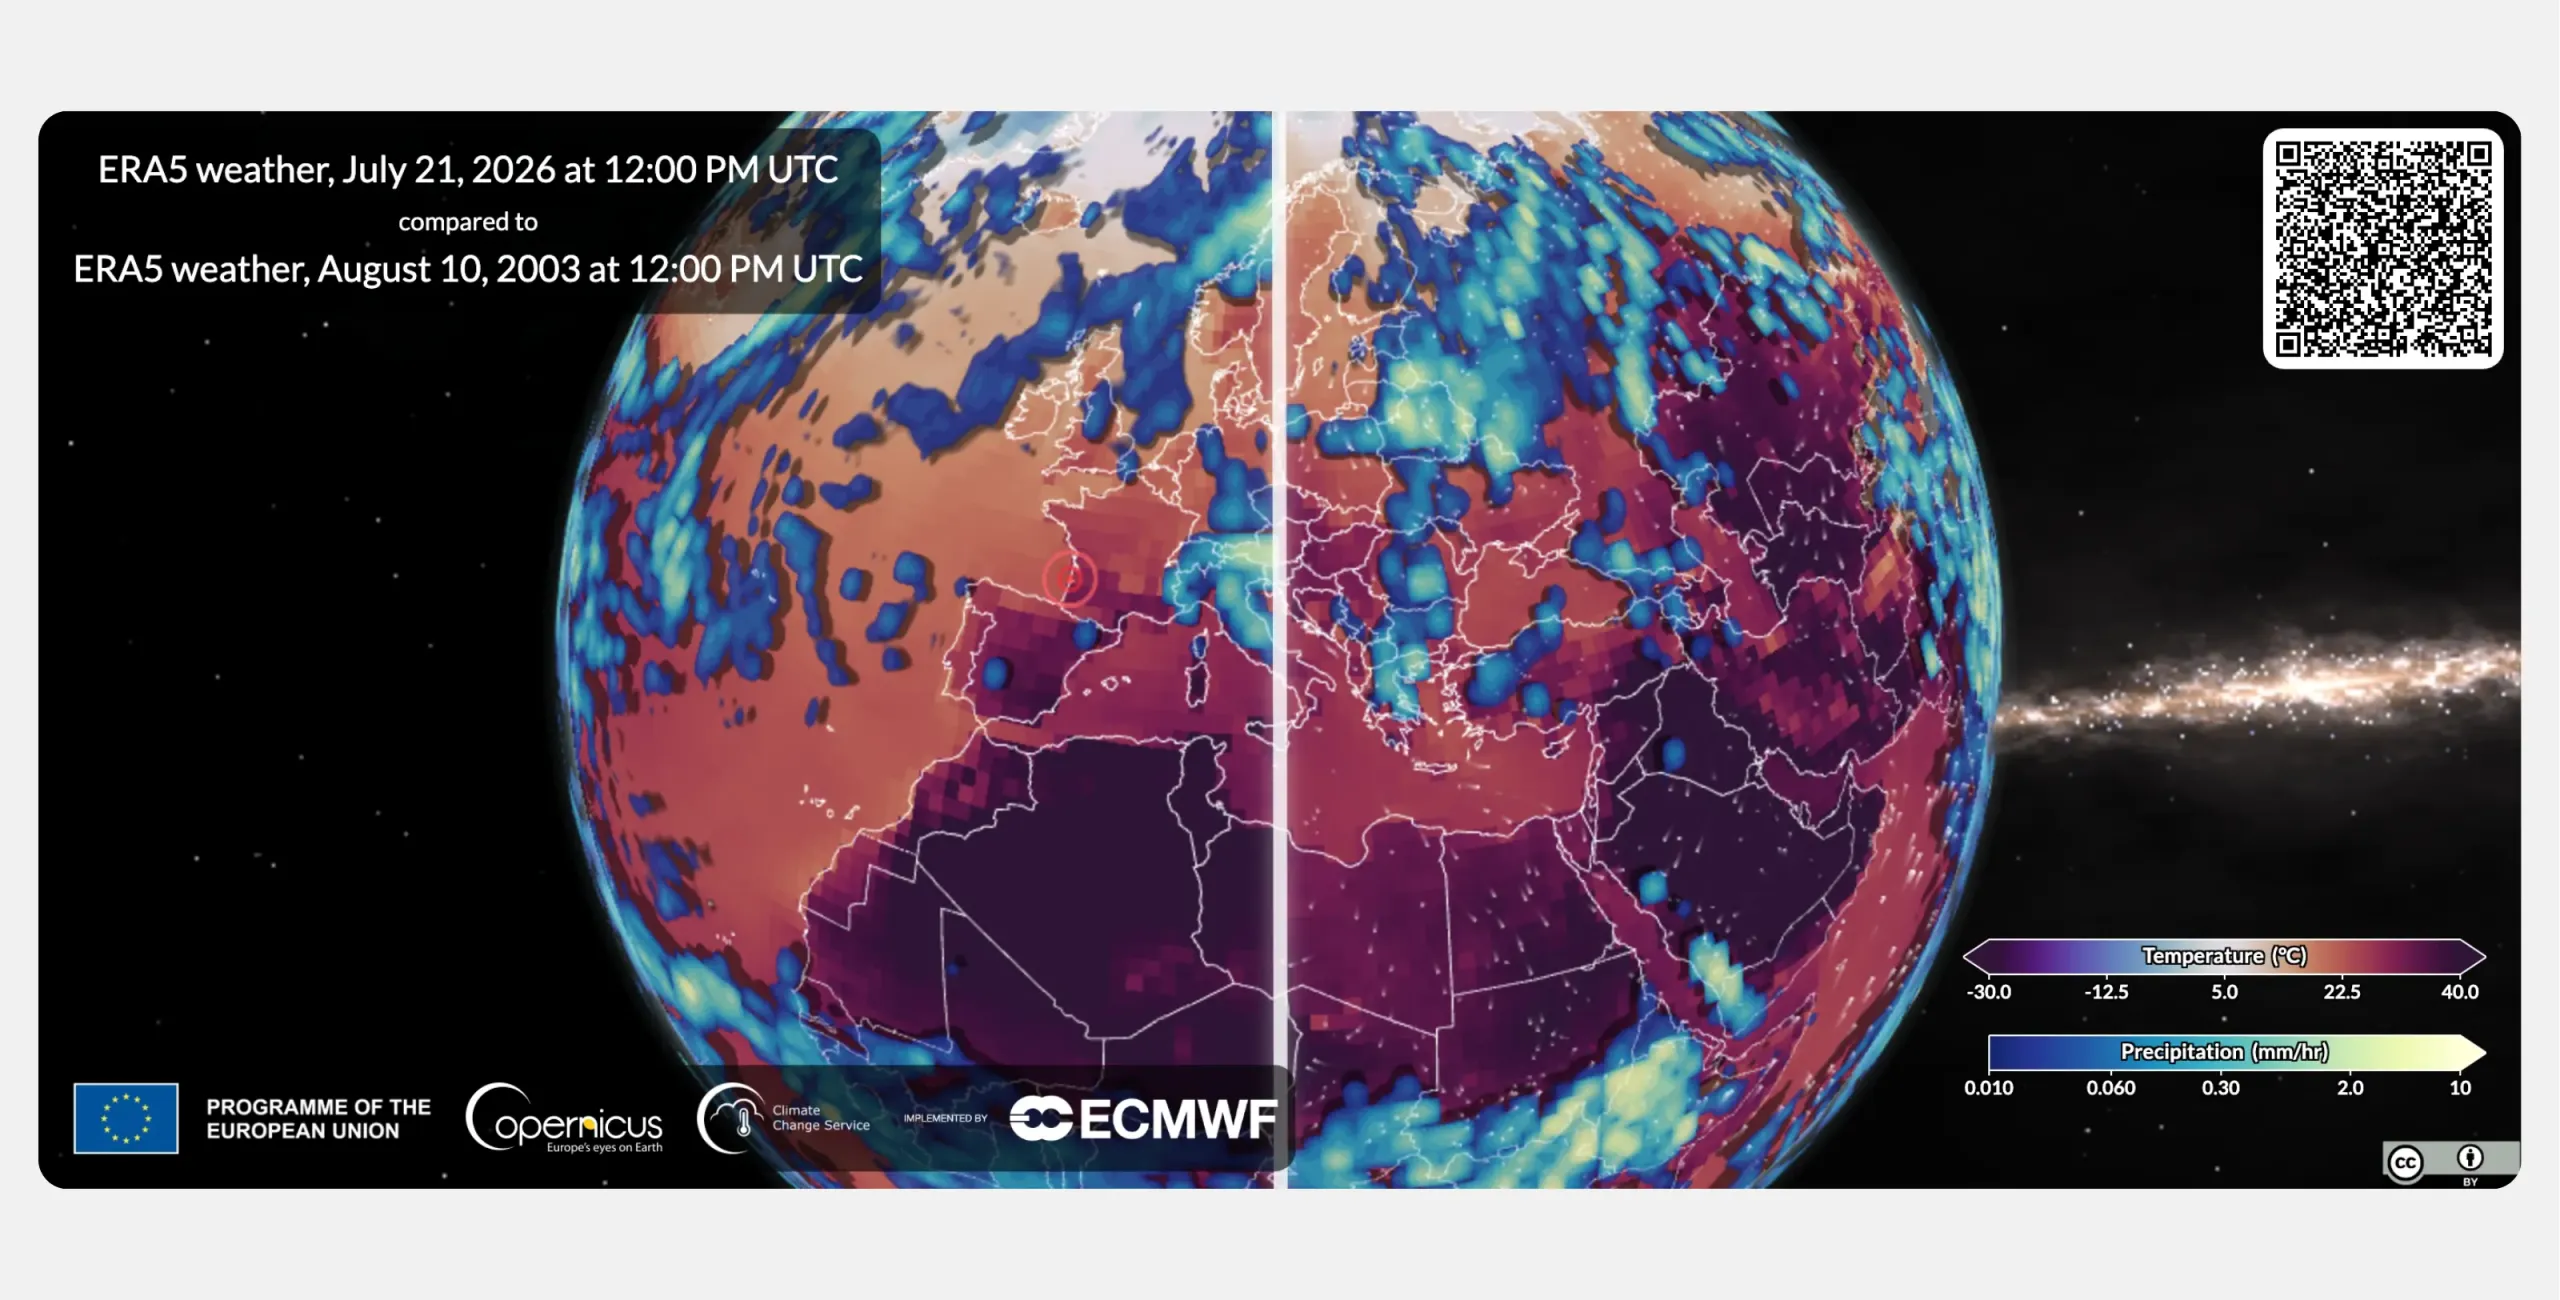
To compare these heatwaves with historical conditions, users can rewind to early August 2003, when a major heatwave affected Europe. The event resulted in thousands of deaths, economic losses estimated at up to €13 billion, and also contributed to forest fires across the region. The Weather Replay App shows users the location and most relevant variables so they can see how the heatwave developed, how long temperatures remained high, how little rainfall there was, and the extent to which temperatures decreased overnight. The controls above allow users to stop, move forward, or backwards and control the speed of the animation. Users can also compare the 2003 and 2026 events side by side and see how each event unfolded. By providing an overview of how major heatwaves developed and the relevant meteorological variables, the Weather Replay App allows users to examine the meteorological conditions associated with each event.
Examining weather conditions during World Cup matches
In November 2022, audiences worldwide watched the World Cup in Qatar. Organisers moved the tournament outside the traditional June–July period to reduce exposure to the high summer temperatures in the Arabic Peninsula. Questions nevertheless remained about the risks associated with playing football in Qatar’s high temperatures.
During this year’s World Cup, heat stress and hydration breaks again received considerable attention. Although the host countries of Mexico, the United States, and Canada differ geographically from Qatar, high temperatures raised comparable concerns for players and spectators.
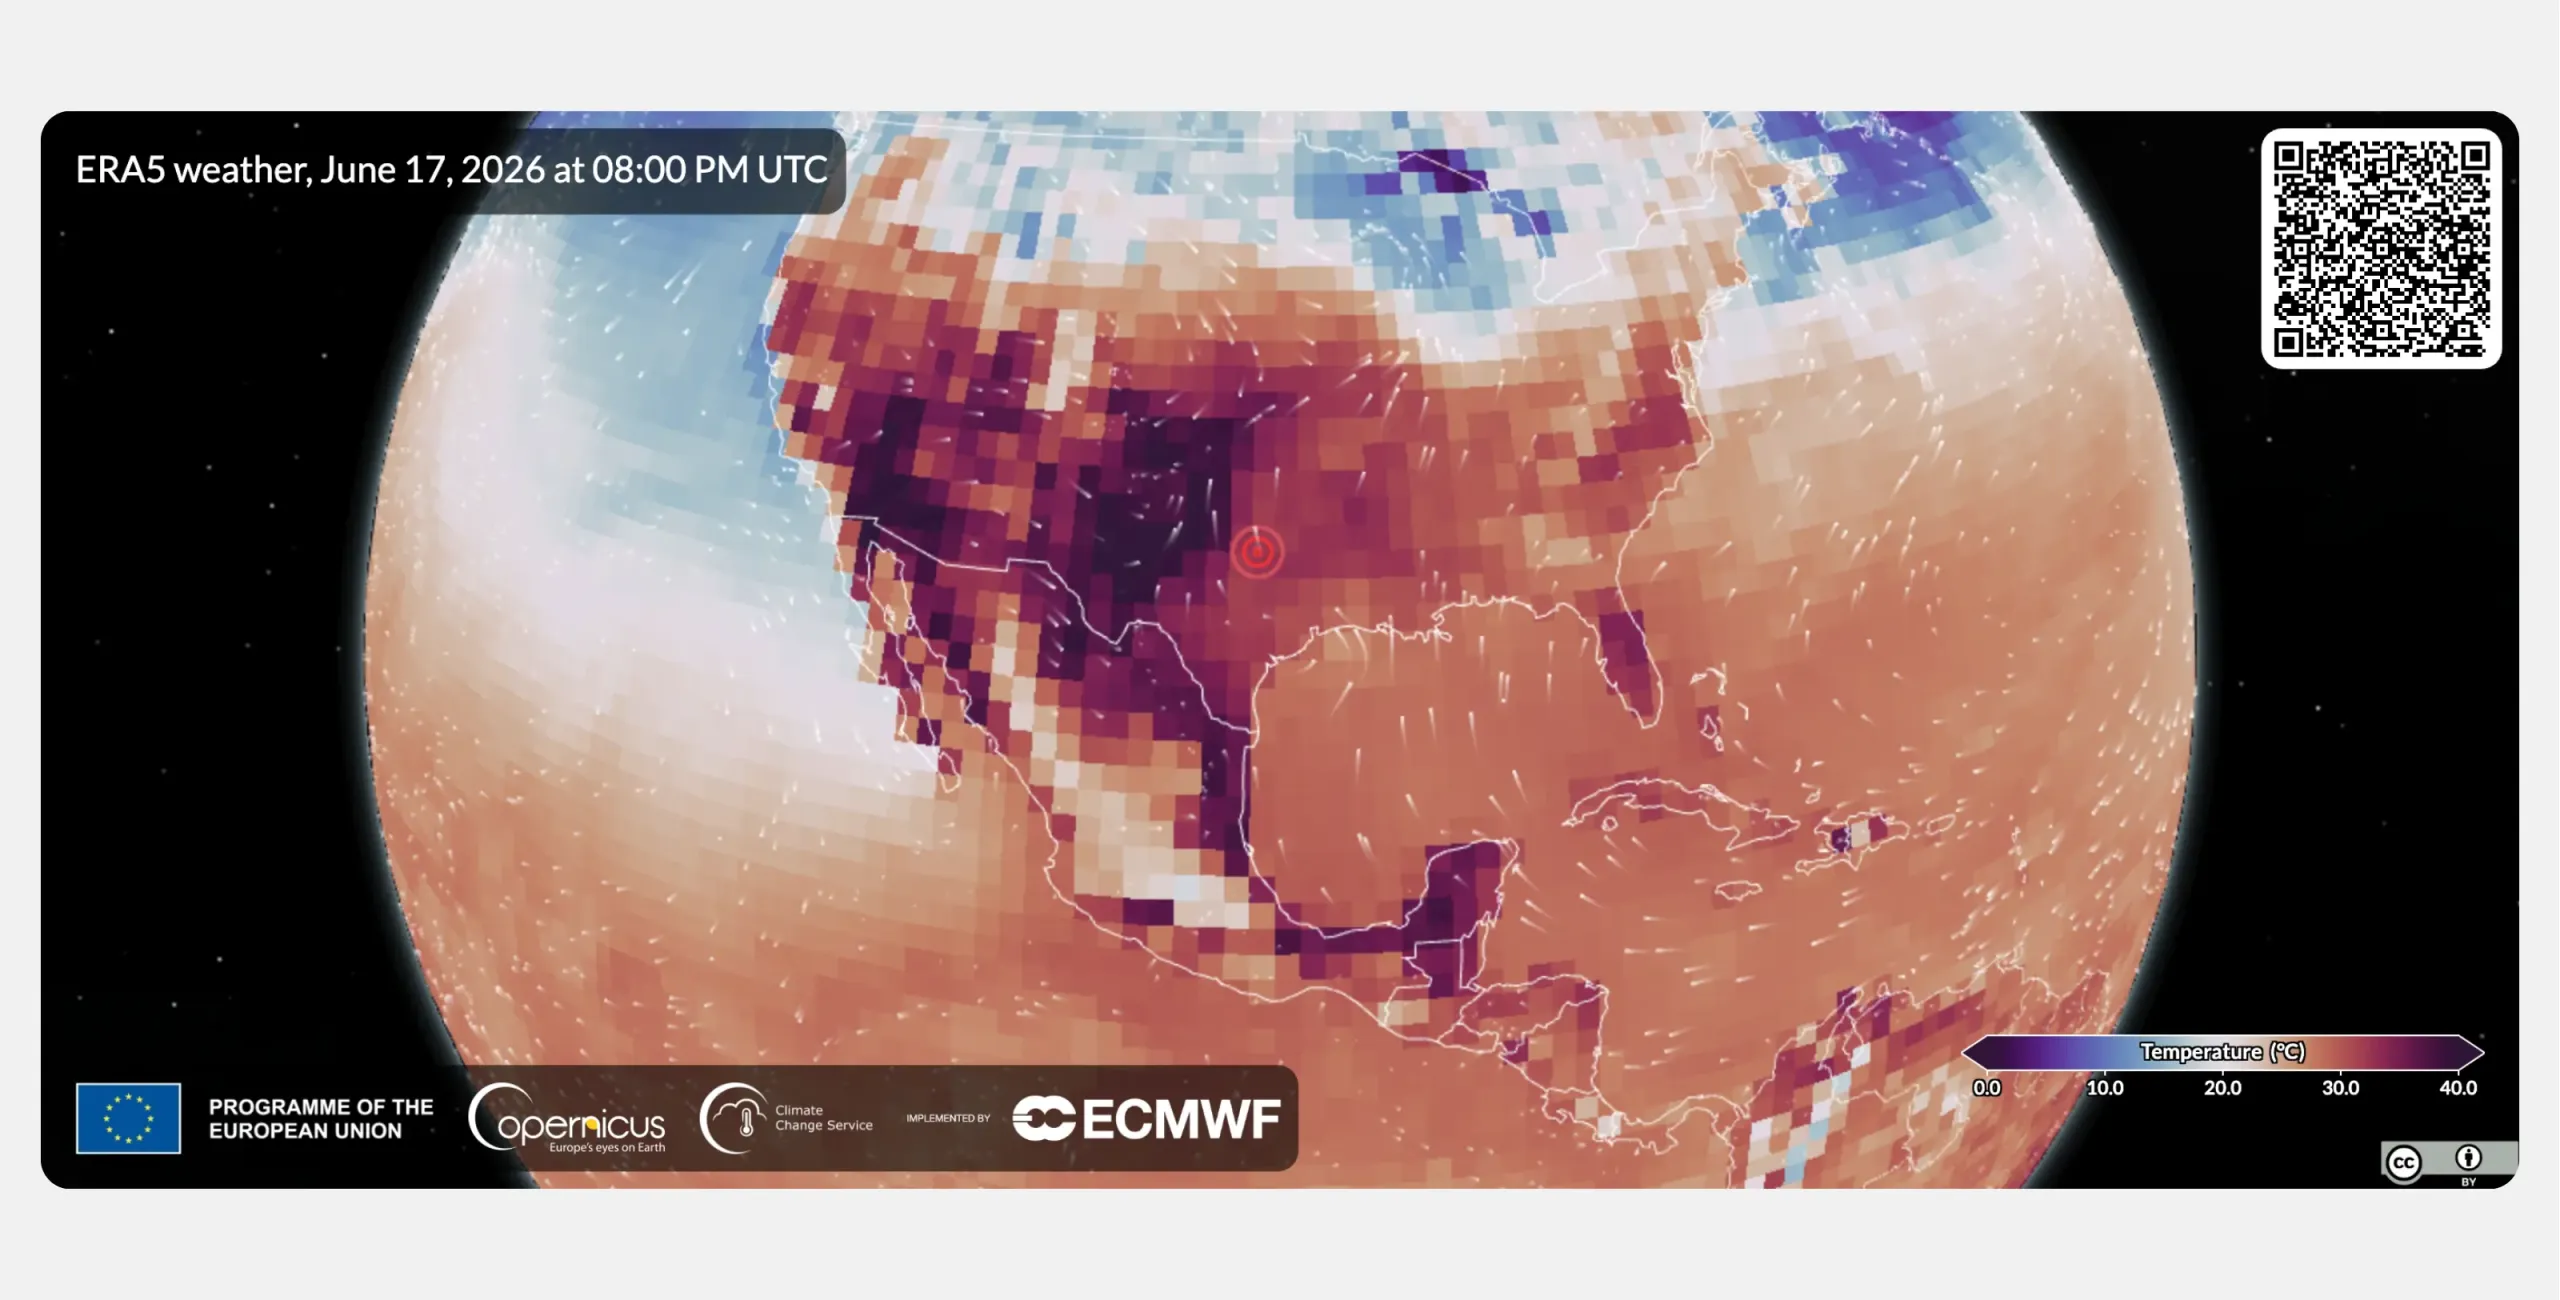
The Weather Replay App allows users to replay the weather conditions in which the games were played. Examples include a reported temperature of 34°C at kick-off during the 2026 England–Croatia match in Arlington, Texas. The temperature during the 2022 Australia–Tunisia match in Al Wakrah, Qatar, was reportedly 27°C.
The app’s comparison function allows users to examine weather conditions during different matches and assess the meteorological context surrounding match postponements. As some extreme weather events become more frequent or intense in certain regions, this information may support decisions about where, when, and how events are organised.
Making complex weather data accessible
The Weather Replay App forms part of a wider family of C3S and ECMWF applications, including Thermal Trace, ERA Explorer, and Climate Pulse. These tools show how Copernicus climate data can be presented through accessible, interactive interfaces which make it easier for users with different levels of expertise to explore and interpret the information. They may also support decision-making in contexts affected by climate variability and climate change.
Allowing users to visualise weather conditions on personally significant dates may also increase public engagement with weather and climate information.
As extreme weather and climate events increase in frequency, intensity, or duration, comparing recent conditions with historical records is becoming increasingly important. By making that comparison straightforward, the C3S Weather Replay App helps users understand the potential implications of these events for society and supports adaptation and planning.