
OBSERVER: Exploring wildfire emissions with CAMS Fire Emissions Watch
Wildfires can affect atmospheric composition and air quality far beyond the affected area. The summer of 2026 brought intense fire activity to France, Spain, and Canada, producing large quantities of smoke, with estimated levels of carbon emissions rising well above their usual levels in several regions. Fire Emissions Watch, a new application from the Copernicus Atmosphere Monitoring Service (CAMS), makes it easier to explore these emissions, follow the transport of smoke, and frame current events in their historical context. Drawing on more than two decades of data, the app allows researchers, policymakers, journalists, and the public to investigate individual events and track how smoke travels. In this Observer, we explore how the app works and what it reveals about the wildfires of the summer of 2026.
The summer of 2026 brought intense wildfire activity to several parts of the Northern Hemisphere. In July, fires in France and Spain forced mass evacuations, threatened population centres, and produced large quantities of smoke. Across the Atlantic, extensive wildfires in Canada affected air quality across the Great Lakes region and in parts of eastern Canada and the north-eastern United States. The Copernicus Atmosphere Monitoring Service (CAMS) launched the Fire Emissions Watch application while these events were still unfolding.
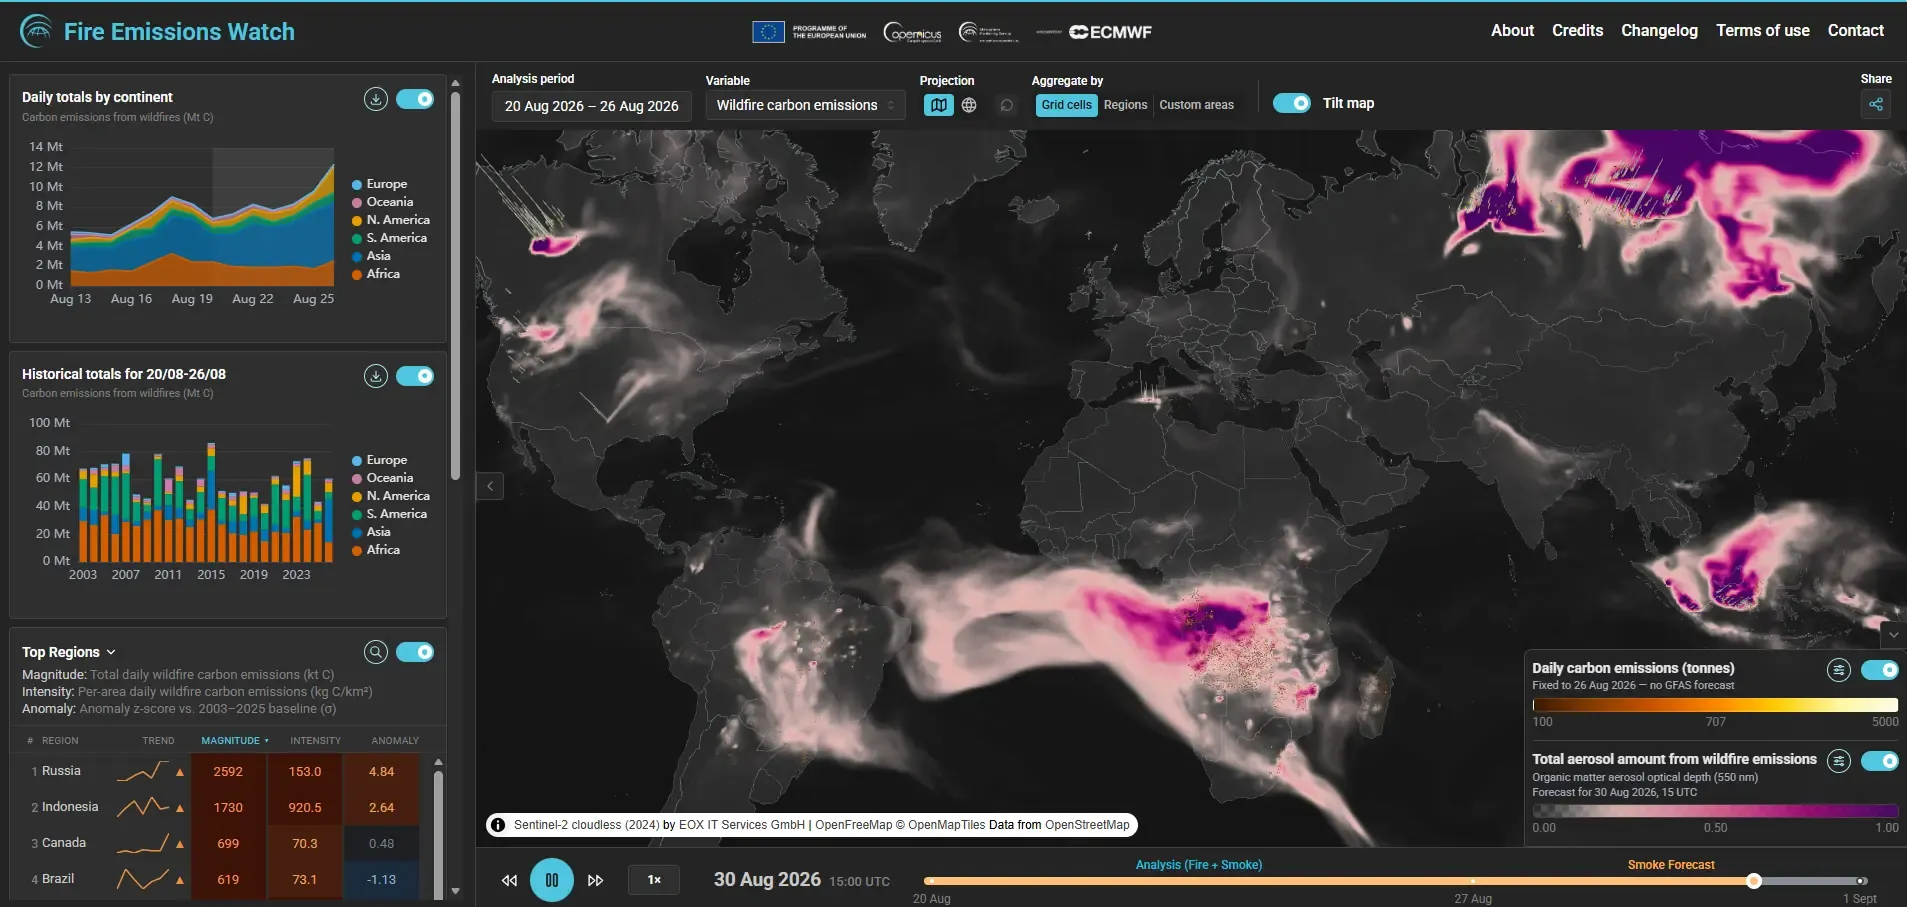
Designed for use by researchers, policymakers, journalists, and the wider public, the Fire Emissions Watch app turns complex global data into maps, animations, and downloadable charts which can be explored in a web browser.
Fire Emissions Watch has the potential to transform global fire‑emissions monitoring. It brings the robust data of our Global Fire Assimilation System (GFAS) dataset into an interactive and innovative interface, giving users, scientists, and the media a completely new perspective on fire emissions
— Laurence Rouil
Director, Copernicus Atmosphere Monitoring Service (CAMS)
From satellite observations to emissions estimates
Fire Emissions Watch is based on data from the CAMS Global Fire Assimilation System (GFAS), which was developed with experts from the Norwegian Institute for Air Research (NILU) and King’s College London. Using observations of active fires from satellite instruments, GFAS estimates emissions using a parameter called fire radiative power (FRP), which measures the rate at which active wildfires release energy as radiation. This measure indicates fire intensity, which can be used to estimate the quantity of fuel, or vegetation, consumed by a fire. GFAS combines these observations with information about vegetation cover and emission factors to calculate the resulting emissions. These factors indicate how much of each substance is released for a given amount of dry matter burned. The quantities vary depending on the type of fuel and the conditions under which it burns.
The estimated emissions are then used in the Integrated Forecasting System (IFS) of the European Centre for Medium-Range Weather Forecasts (ECMWF) to produce forecasts of atmospheric composition, including the transport of pollutants related to wildfire smoke. Rather than simply mapping where fires have occurred or how much land has burned, Fire Emissions Watch uses estimated carbon emissions to indicate the overall scale and intensity of fire activity, alongside IFS forecasts showing the transport of smoke and its effects on atmospheric composition.
How to explore a wildfire episode
Users of the app start by clicking ‘Explore the Map’ in the app interface, then choosr an analysis period. This could be a few days covering a particular fire, an entire month, or a longer period showing how emissions have accumulated through the year.
The geographical scale can then be adjusted according to the matter being investigated. The global view provides a rapid comparison between countries and continents. Users can also select individual countries and administrative regions, examine specific grid cells, or draw a custom area on the map. The custom selection is particularly useful when a fire crosses administrative boundaries or when several nearby fires need to be considered together.
Different display modes provide different perspectives on the selected event. Daily values show when emissions increased or decreased, while cumulative charts reveal how quickly they built up over a month or year. Historical comparisons place the current figures alongside every year since 2003, as well as the long-term mean.
The map displays the location and relative intensity of fire activity. Users can replay the selected period to follow the development of fire activity and view the associated transport of smoke. Charts can be downloaded directly from the application for further analysis, presentations, or reporting.
France: a sudden rise in emissions
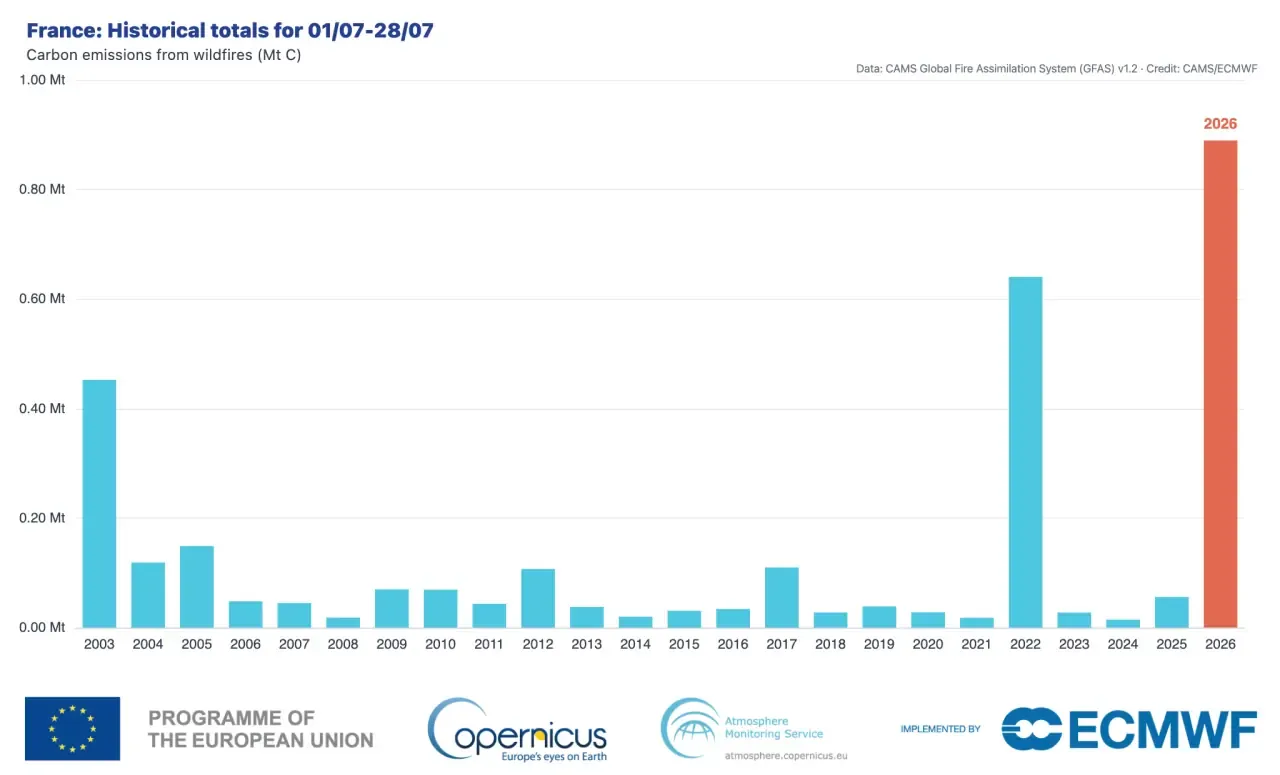
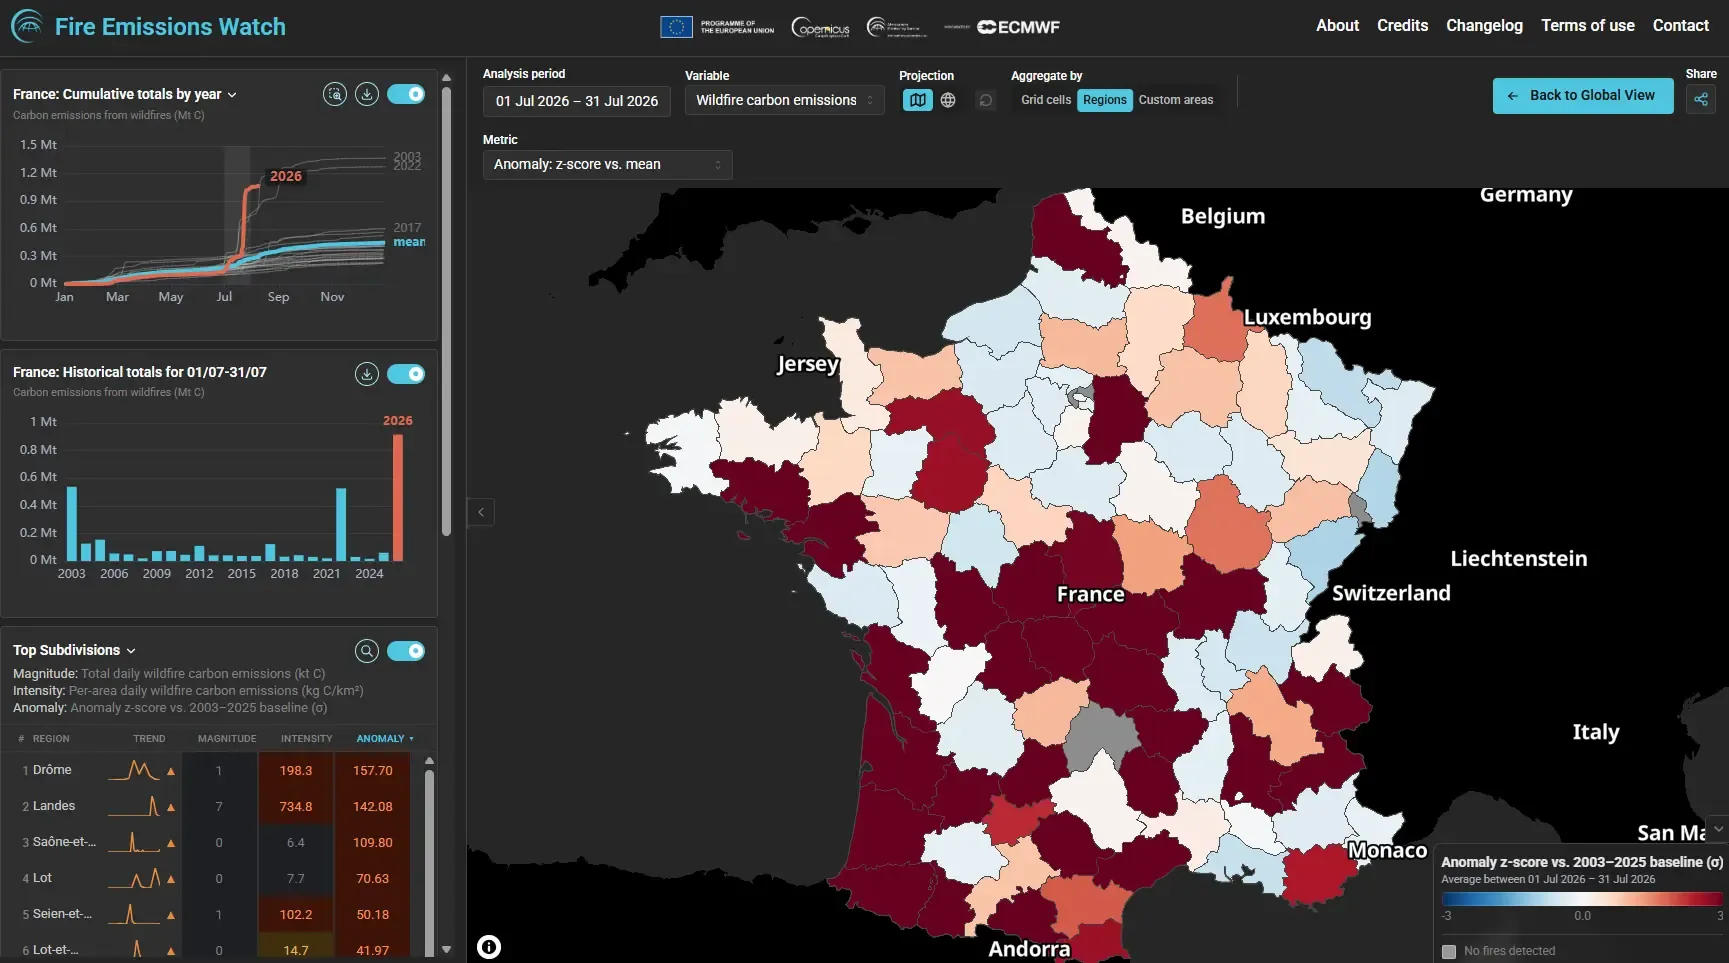
The value of the historical comparison is particularly clear when examining the July 2026 wildfires in France. Several intense fires developed during the month, including fires along the Mediterranean coast and in south-western France. The fires in Gironde and Landes led to mass evacuations and had substantial effects on air quality across parts of southern France.
In the Fire Emissions Watch cumulative chart, France’s 2026 emissions initially remain relatively close to the long-term mean. The line then rises almost vertically during the second half of July as emissions from the major fires accumulate.
By early August, France’s cumulative wildfire carbon emissions for 2026 had exceeded 1 megatonne of carbon. This figure was already the third-highest annual total in the GFAS record, behind only the complete annual totals for 2022 and 2003.
Spain: examining events at regional level
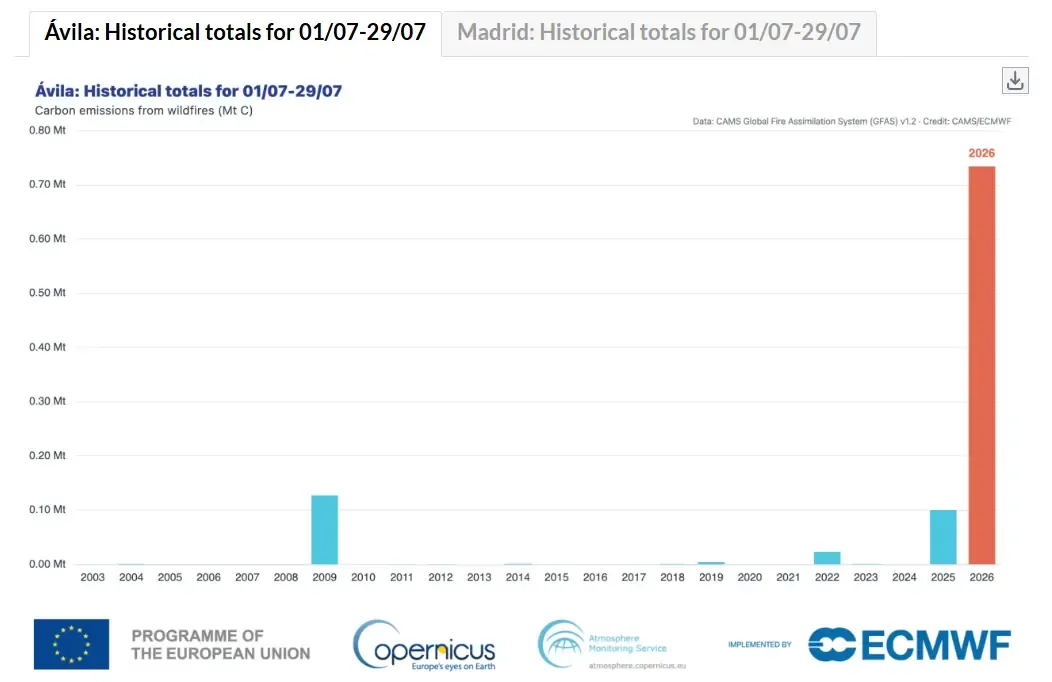
In Spain, large fires affected several parts of the country during July, including areas around Zaragoza, Girona, Almería, and Guadalajara. Later in the month, major fires in and around Ávila and Madrid threatened communities and strongly affected air quality across central Spain.
Fire Emissions Watch allows users to move beyond the national total and investigate the areas most affected. Selecting an individual province, grid cell, or custom-drawn area reveals when local emissions increased and how the episode compared with previous years.
For Ávila and Madrid, GFAS data show that estimated emissions during July were well above their usual levels. CAMS forecasts also indicated that smoke from the central Spanish fires could be carried northwards and westwards by the prevailing airflow. A long aerosol plume subsequently extended from north-western Spain towards northern Europe.
The episode illustrates the complexity of interpreting air quality. Madrid was affected by the combined influence of wildfire smoke, emissions from sources such as traffic, and Saharan dust. Forecasting the concentration of particulate matter at ground level therefore involves more than identifying a fire or monitoring a visible plume.
Canada: smoke without borders
The app’s global view shows the very different scale of the fires in Canada, which made the country the largest source of fire emissions worldwide during July 2026.
Large fires had been burning in the Northwest Territories since the end of June. On 13 July, wildfire activity also increased sharply in north-western Ontario, with numerous fires burning along a front extending for nearly 500 kilometres. Within days, Ontario had recorded its highest annual total of estimated fire emissions in the GFAS dataset.
Smoke from the Ontario and other Canadian wildfires caused severe deterioration in air quality across the Great Lakes region, including Toronto, before being carried towards eastern Canada, the north-eastern United States, and the North Atlantic. Smoke from fires further north continued to affect the Canadian Arctic.
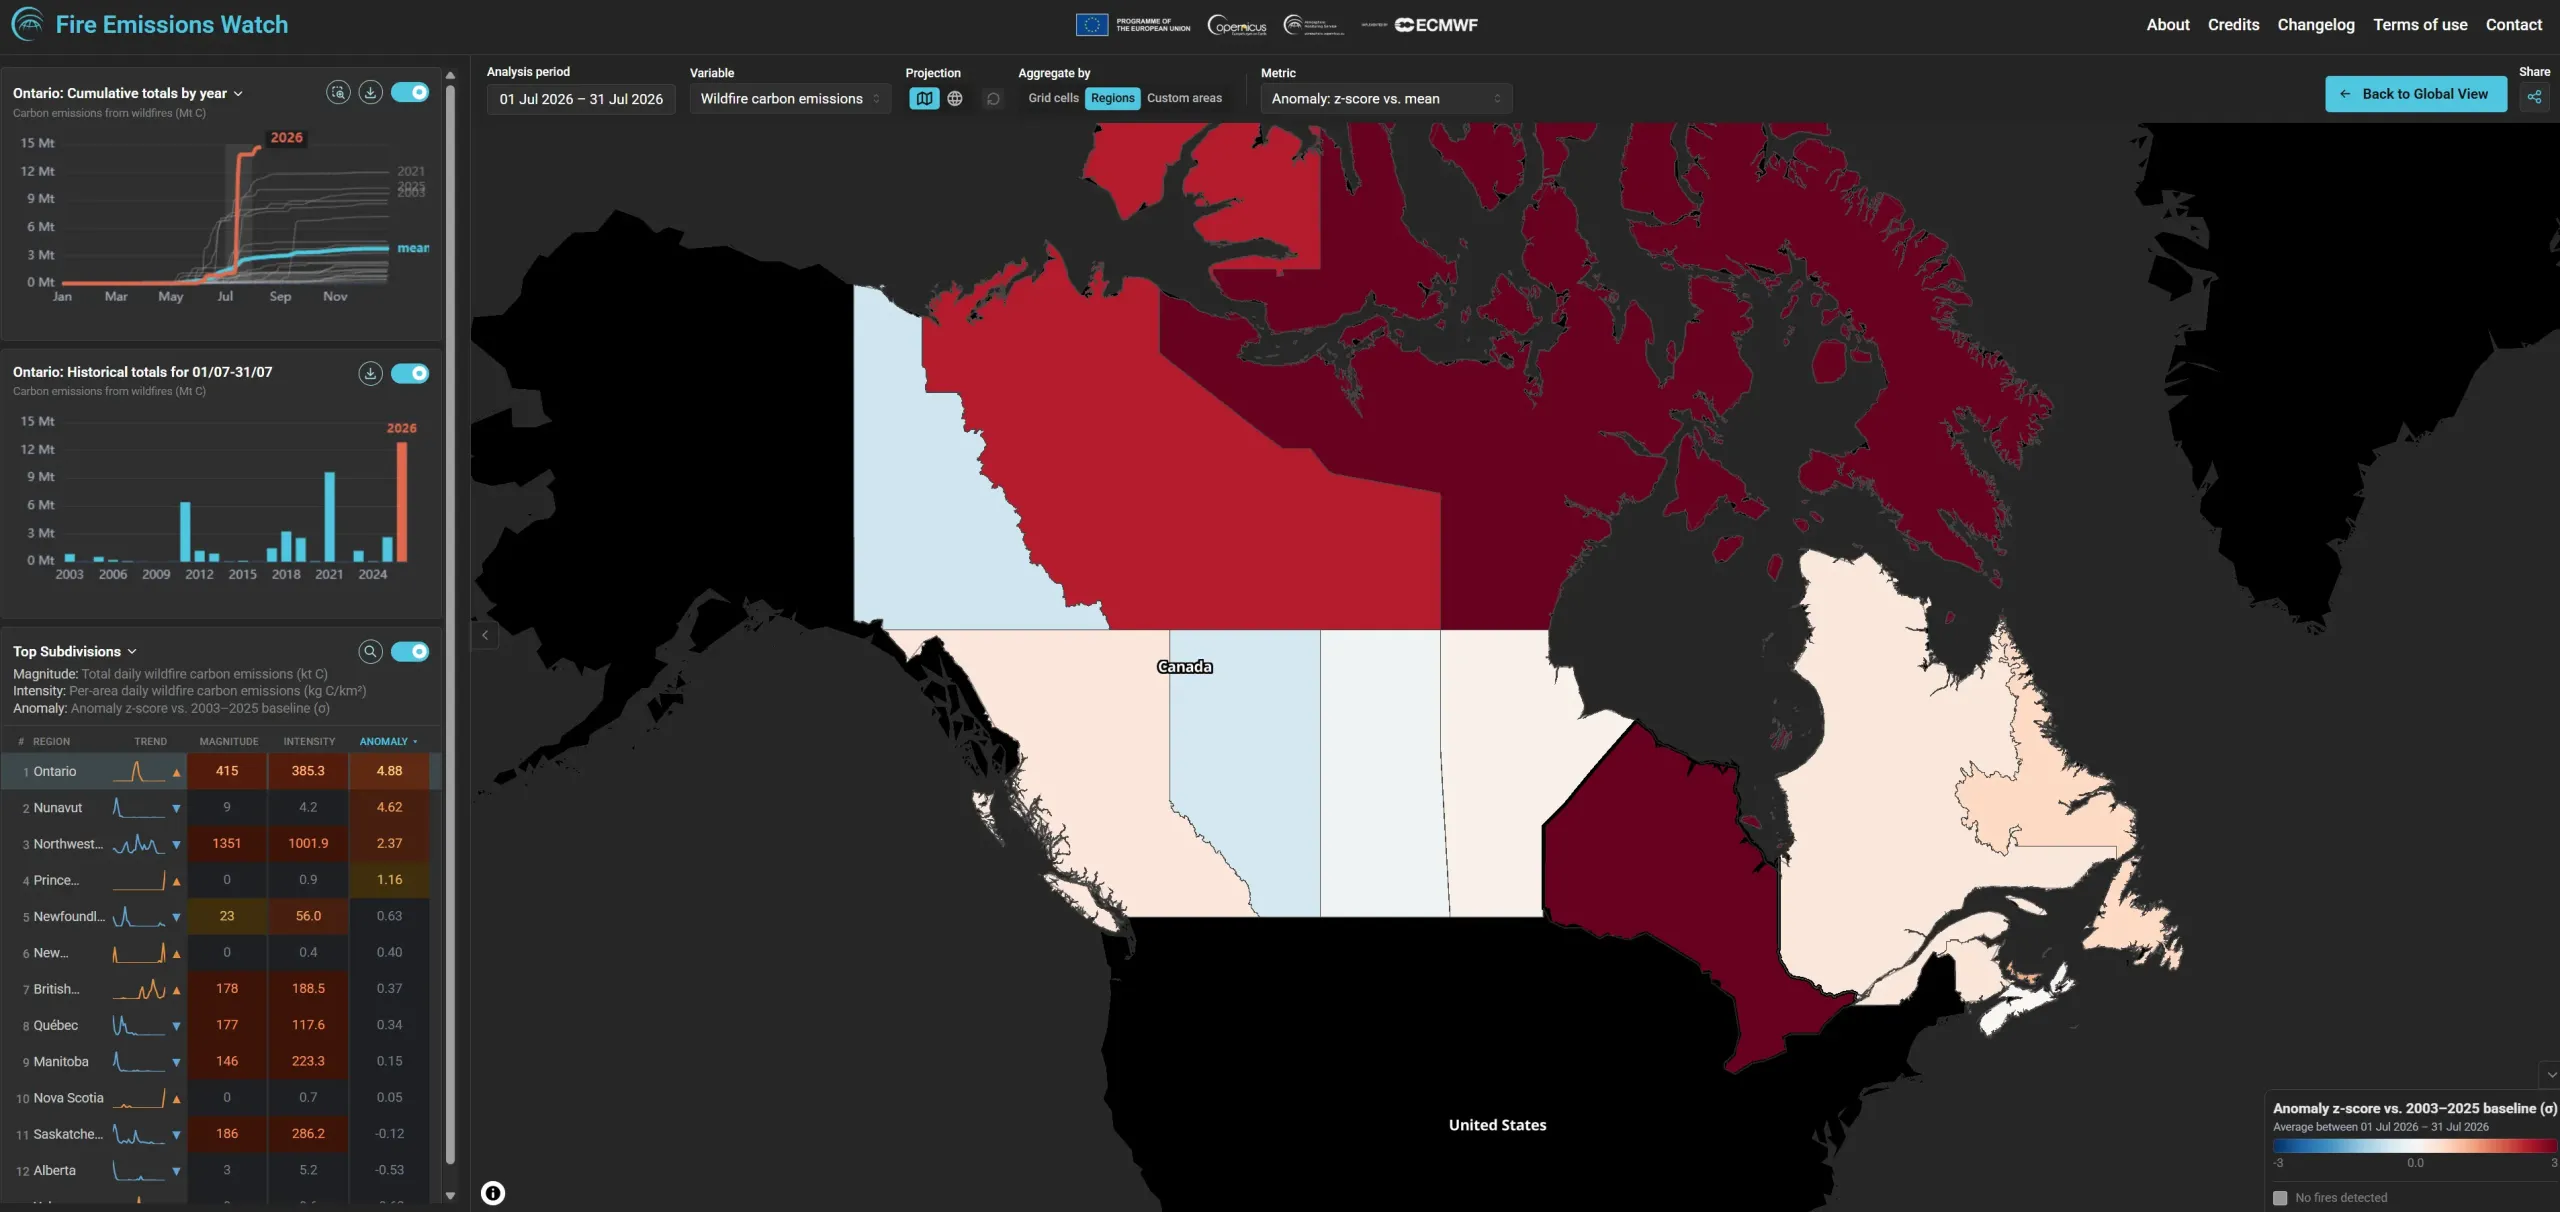
Selecting Ontario in the Fire Emissions Watch app and setting the analysis period to July 2026 reveals how exceptional the episode was. The map compares emissions across Canadian provinces and territories with their 2003–2025 baselines, with red indicating higher-than-usual activity. Ontario recorded the country’s largest anomaly, while the historical chart shows that its estimated emissions for July 2026 exceeded those of the same period in every previous year in the GFAS record. By the end of July, the surge had pushed Ontario’s cumulative 2026 emissions above the final annual total recorded in every previous year since the GFAS record began in 2003.
Why wildfire emissions matter
Fine particulate matter, or PM2.5, is among the components of wildfire smoke of greatest concern for health. These particles are small enough to penetrate deep into the lungs and can aggravate respiratory and cardiovascular conditions. Children, senior citizens, pregnant women, and people with existing health conditions may be particularly vulnerable.
Smoke can affect air quality even when a fire poses no direct threat to a community. Understanding how emissions evolve and where smoke may travel supports atmospheric monitoring and can provide context for air-quality forecasts.
Fire Emissions Watch is not intended to replace official local air-quality measurements, health advice, or emergency warnings. Instead, it provides a broader view of the origin, scale, and atmospheric development of fire-emission episodes. Users should always consult national or local authorities when making health or safety decisions.
More than a picture of the present
The application’s historical record extends back to 2003, allowing users to revisit major events including the European heatwave and fires of 2003, the Amazon fires of 2019, and Canada’s record-breaking 2023 wildfire season.
These comparisons indicate whether current fire activity falls within the usual range or represents an exceptional event in the historical record.
By bringing maps, emissions estimates, smoke transport, and historical comparisons together within a single interface, Fire Emissions Watch makes it easier to answer that question at any scale, from an individual region to the entire globe.