
OBSERVER: CAMS Atmosphere Watch reveals how ozone, wildfire smoke, and dust shaped air quality in 2026
Extreme heat, ground-level ozone, major wildfires, and long-range dust transport affected millions of people in 2026. The first Copernicus Atmosphere Monitoring Service (CAMS) Atmosphere Watch report, published on 30 September 2026, examines how ozone, wildfire smoke, and desert dust travel across borders and affect air quality far from their sources. Europe’s summer heatwaves showed how local emissions can combine with pollution arriving from elsewhere and worsen air quality. In this Observer, we look at the report’s main findings and how CAMS monitoring helps authorities and researchers follow pollution as it moves.
The Copernicus Atmosphere Monitoring Service (CAMS) combines millions of observations from satellites, ground-based networks, aircraft, and other sources with atmospheric modelling to produce a detailed picture of the chemical composition of the atmosphere globally. Its analyses and forecasts indicate how pollutants develop and travel, including in areas in which no ground-based measurements are not available. CAMS Atmosphere Watch, a new publication which provides an overview of key topics in air quality and atmospheric composition, draws on these capabilities. Its first edition, published on 30 September 2026, focuses on three topics: ground-level ozone, smoke from burning biomass and extreme wildfires, and desert dust transported by wind.
Ground-level ozone remains a challenge for Europe
Ozone has very different effects depending on where it is present. In the stratosphere, the layer of the atmosphere between roughly 10 km and 50 km above the ground, it helps protect life against harmful ultraviolet radiation. At ground level, it harms human health, ecosystems, and affects crop yields. Ground-level ozone is a secondary pollutant: it is not emitted directly, but forms through chemical reactions involving nitrogen oxides and volatile organic compounds (VOCs) in the presence of sunlight. These precursor pollutants have both human and natural sources, including transport, industry, domestic solvents, and vegetation.
Stronger solar radiation during summer provokes the chemical reactions which generate ozone, while stable meteorological conditions, calm weather with little wind, allows it to accumulate. High temperatures can also increase natural emissions of VOCs from vegetation. CAMS Atmosphere Watch identifies ground-level ozone as an illustration of the close relationship between air pollution and climate change.
Ozone pollution is a stark reminder of how interconnected our atmosphere, climate, health, and livelihoods really are. This harmful pollutant and our changing climate negatively impact the air we breathe, determine the health of our ecosystems, and govern our ability to grow food.
— Laurence Rouil
Director, Copernicus Atmosphere Monitoring Service
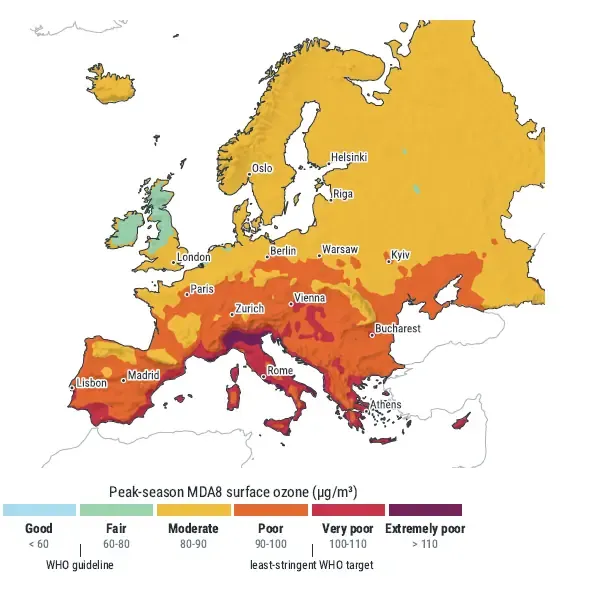
Exposure in the first eight months of 2026 was extremely high and persistent across Asia, while Europe and North America recorded several days of very high exposure during repeated summer heatwaves. According to the report’s analysis of 2026, up to 15 September, only 5 % of the global population was exposed to long-term ozone levels rated as ‘good’, and 15 % to levels rated as ‘fair’, against thresholds based on World Health Organization (WHO) guidelines. This assessment uses the peak-season average, calculated by averaging the daily maximum eight-hour mean ozone concentrations over the six consecutive months with the highest average concentrations.
For Europe, the findings show a clear north-south gradient, with peak-season surface ozone highest across southern Europe. Although European air quality assessments show that measures to reduce emissions have lowered concentrations of human-made particulate matter, nitrogen dioxide, and sulphur dioxide, ozone shows no clear downward trend.
During the heatwaves which took place from June to August, local emissions of gases which react to form ozone and ozone already present across the Northern Hemisphere contributed to higher ozone concentrations. Higher temperatures favoured ozone formation, while stable conditions allowed it to build up and persist. European emissions also contributed to this ozone pollution and may have affected air quality in other regions. The findings show why understanding ozone requires considering both local emissions and long-range transport.
Wildfire smoke carries pollution across borders
The same high temperatures and dry conditions which worsened ozone pollution also increased the risk of major wildfires. Fires release a wide range of pollutants, including fine particulate matter (PM2.5). These particles are 2.5 micrometres or less in diameter and can penetrate deep into the lungs and harm human health. Once emitted, these pollutants can travel far from the fires, turning a local emergency into a regional or continental poor air-quality episode.
CAMS Atmosphere Watch describes the consequences in terms of air quality of the large wildfires which ignited in the Gironde and Landes departments of south-western France on 22 July 2026, alongside fires in the provinces of Ávila and Madrid in central Spain. The French fires significantly worsened air quality hundreds of kilometres away. Madrid and Ávila recorded their highest carbon emissions from wildfires since at least 2003 by a very large margin, with CAMS analysis also showing extreme levels of fine particle emissions from both fire hotspots.
CAMS reporting on western Europe’s July fires provides further detail on their air quality impacts. Forecasts showed high ground-level PM2.5 concentrations downwind of the fires in south-western France, confirmed by ground-based measurements. Estimated wildfire carbon emissions in Ávila and Madrid from 1 to 29 July were the highest for that period in the CAMS Global Fire Assimilation System (GFAS) record which started in 2003. Madrid’s poor air quality reflected the combined effects of traffic pollution, wildfire smoke, and Saharan dust.
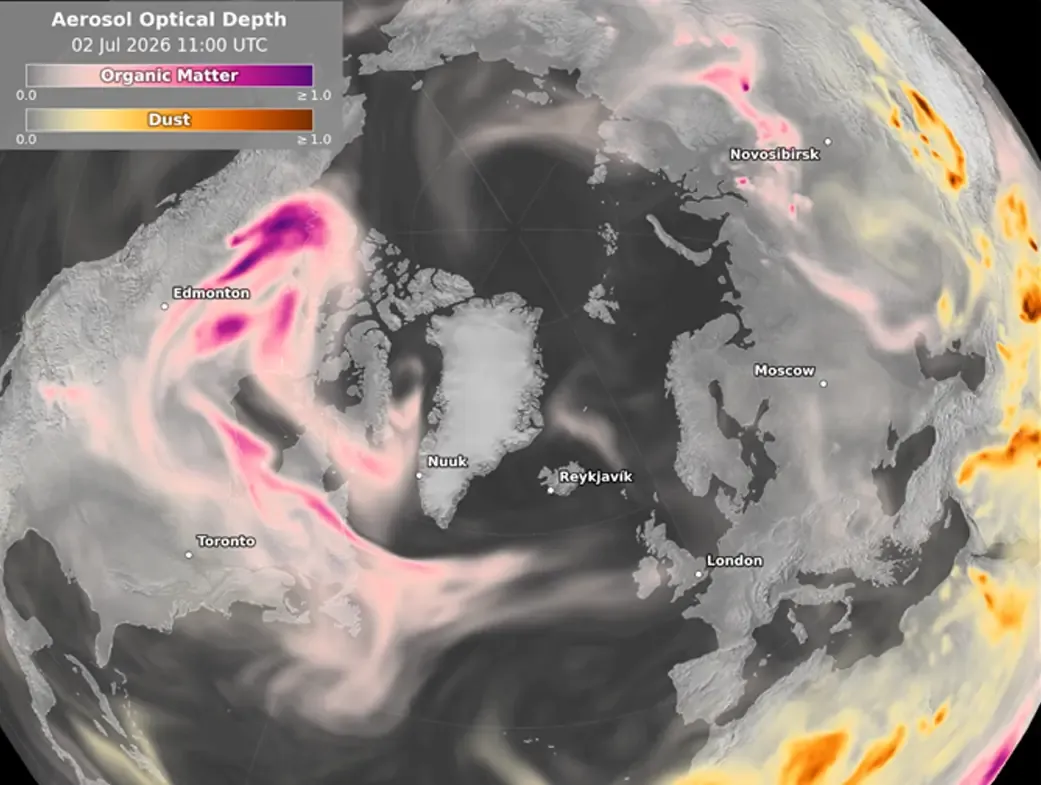
The report also discusses the fire which broke out in August in the High Fens, an upland nature reserve in eastern Belgium. Smoke from the fire travelled across Germany and reached Poland. Europe received smoke from further afield too. Several plumes from North American wildfires crossed the Atlantic during 2026 and added to local PM2.5 pollution in parts of Europe.
Smoke contains many different chemical compounds, some of which can react to form secondary pollutants, including ozone. However, researchers are still studying exactly how much wildfires contribute to ozone pollution in Europe. CAMS is following this research closely, as separating the contributions of different sources is necessary to understand complex pollution episodes.
Frequent Saharan dust episodes in European skies
Desert dust is another important source of cross-border air pollution. Winds lift mineral dust from deserts and dry areas into the atmosphere, and the resulting plumes can travel thousands of kilometres, depending on meteorological conditions. The Sahara is a major source. Its dust frequently moves across the Mediterranean into Europe or across the North Atlantic towards the Caribbean.
The report records several significant episodes in 2026, including very high concentrations of PM10 (particles 10 micrometres or less in diameter) in February and a major movement of dust and smoke from West Africa towards Cape Verde and the Canary Islands. In June, dust plumes crossed the Atlantic, and in July a large dust storm swept across the Sahara from north to south.
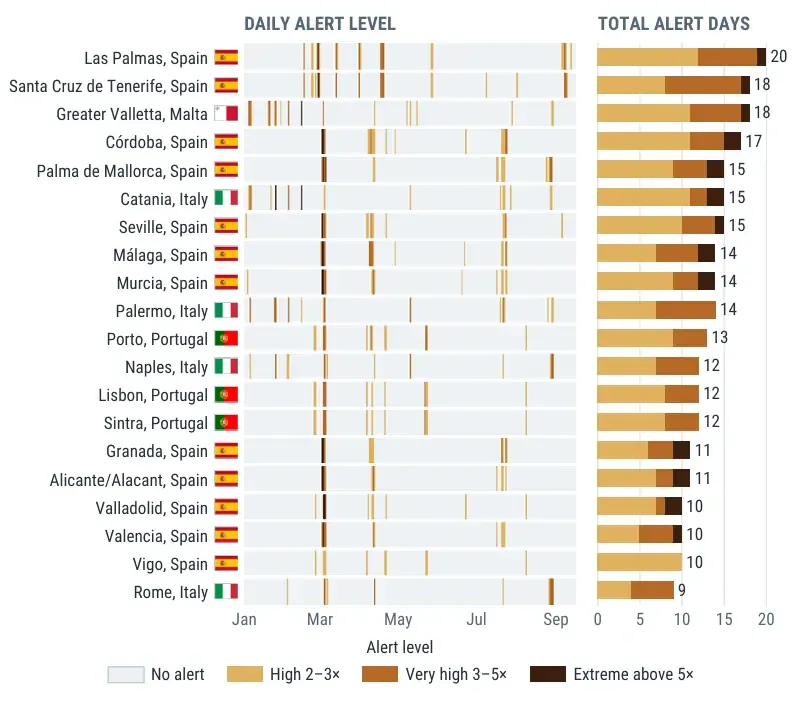
Las Palmas de Gran Canaria had the largest number of dust alert days among European cities, followed by Santa Cruz de Tenerife, Greater Valletta in Malta, and Córdoba in southern Spain. An alert is issued when forecast dust aerosol optical depth, a measure of how strongly airborne dust blocks sunlight, exceeds the long-term average for that day of the year by a set factor. The alerts therefore indicate unusually high amounts of dust in the atmosphere; they do not provide direct information on surface pollution or personal exposure directly.
The report notes that dust transport is part of the natural cycle of the atmosphere and plays a positive role in many ecosystems. Nevertheless, dust can increase particulate matter concentrations far from its source and affect air quality. In the Iberian Peninsula and western Mediterranean, low-pressure systems can generate southerly winds from North Africa, carrying Saharan dust over Europe. Dust can produce hazy conditions and dimmed sunlight, a phenomenon known as calima in the Canary Islands. CAMS monitoring helps track the extent of these episodes and forecast where dust plumes are likely to travel next.
Open data supports responses to pollution
CAMS forecasts and analyses help authorities and researchers understand the sources and movement of pollution. GFAS uses satellite observations of the heat released by active fires to estimate biomass-burning emissions. These estimates are used to forecast smoke transport. The Fire Emissions Watch application, launched in July 2026, provides maps and graphs of fire emissions and smoke plumes.
The Atmosphere Watch report draws on a range of CAMS analyses to show how ozone, wildfire smoke, and desert dust shape air quality around the world. By tracing pollution transport from its sources to the communities it affects, the report helps readers understand how local emissions, weather conditions, and pollution transported from elsewhere combine. Its findings show why efforts to improve air quality must consider sources beyond national borders.