Show Your Stripes Day traces 80 years of temperature change in Brussels
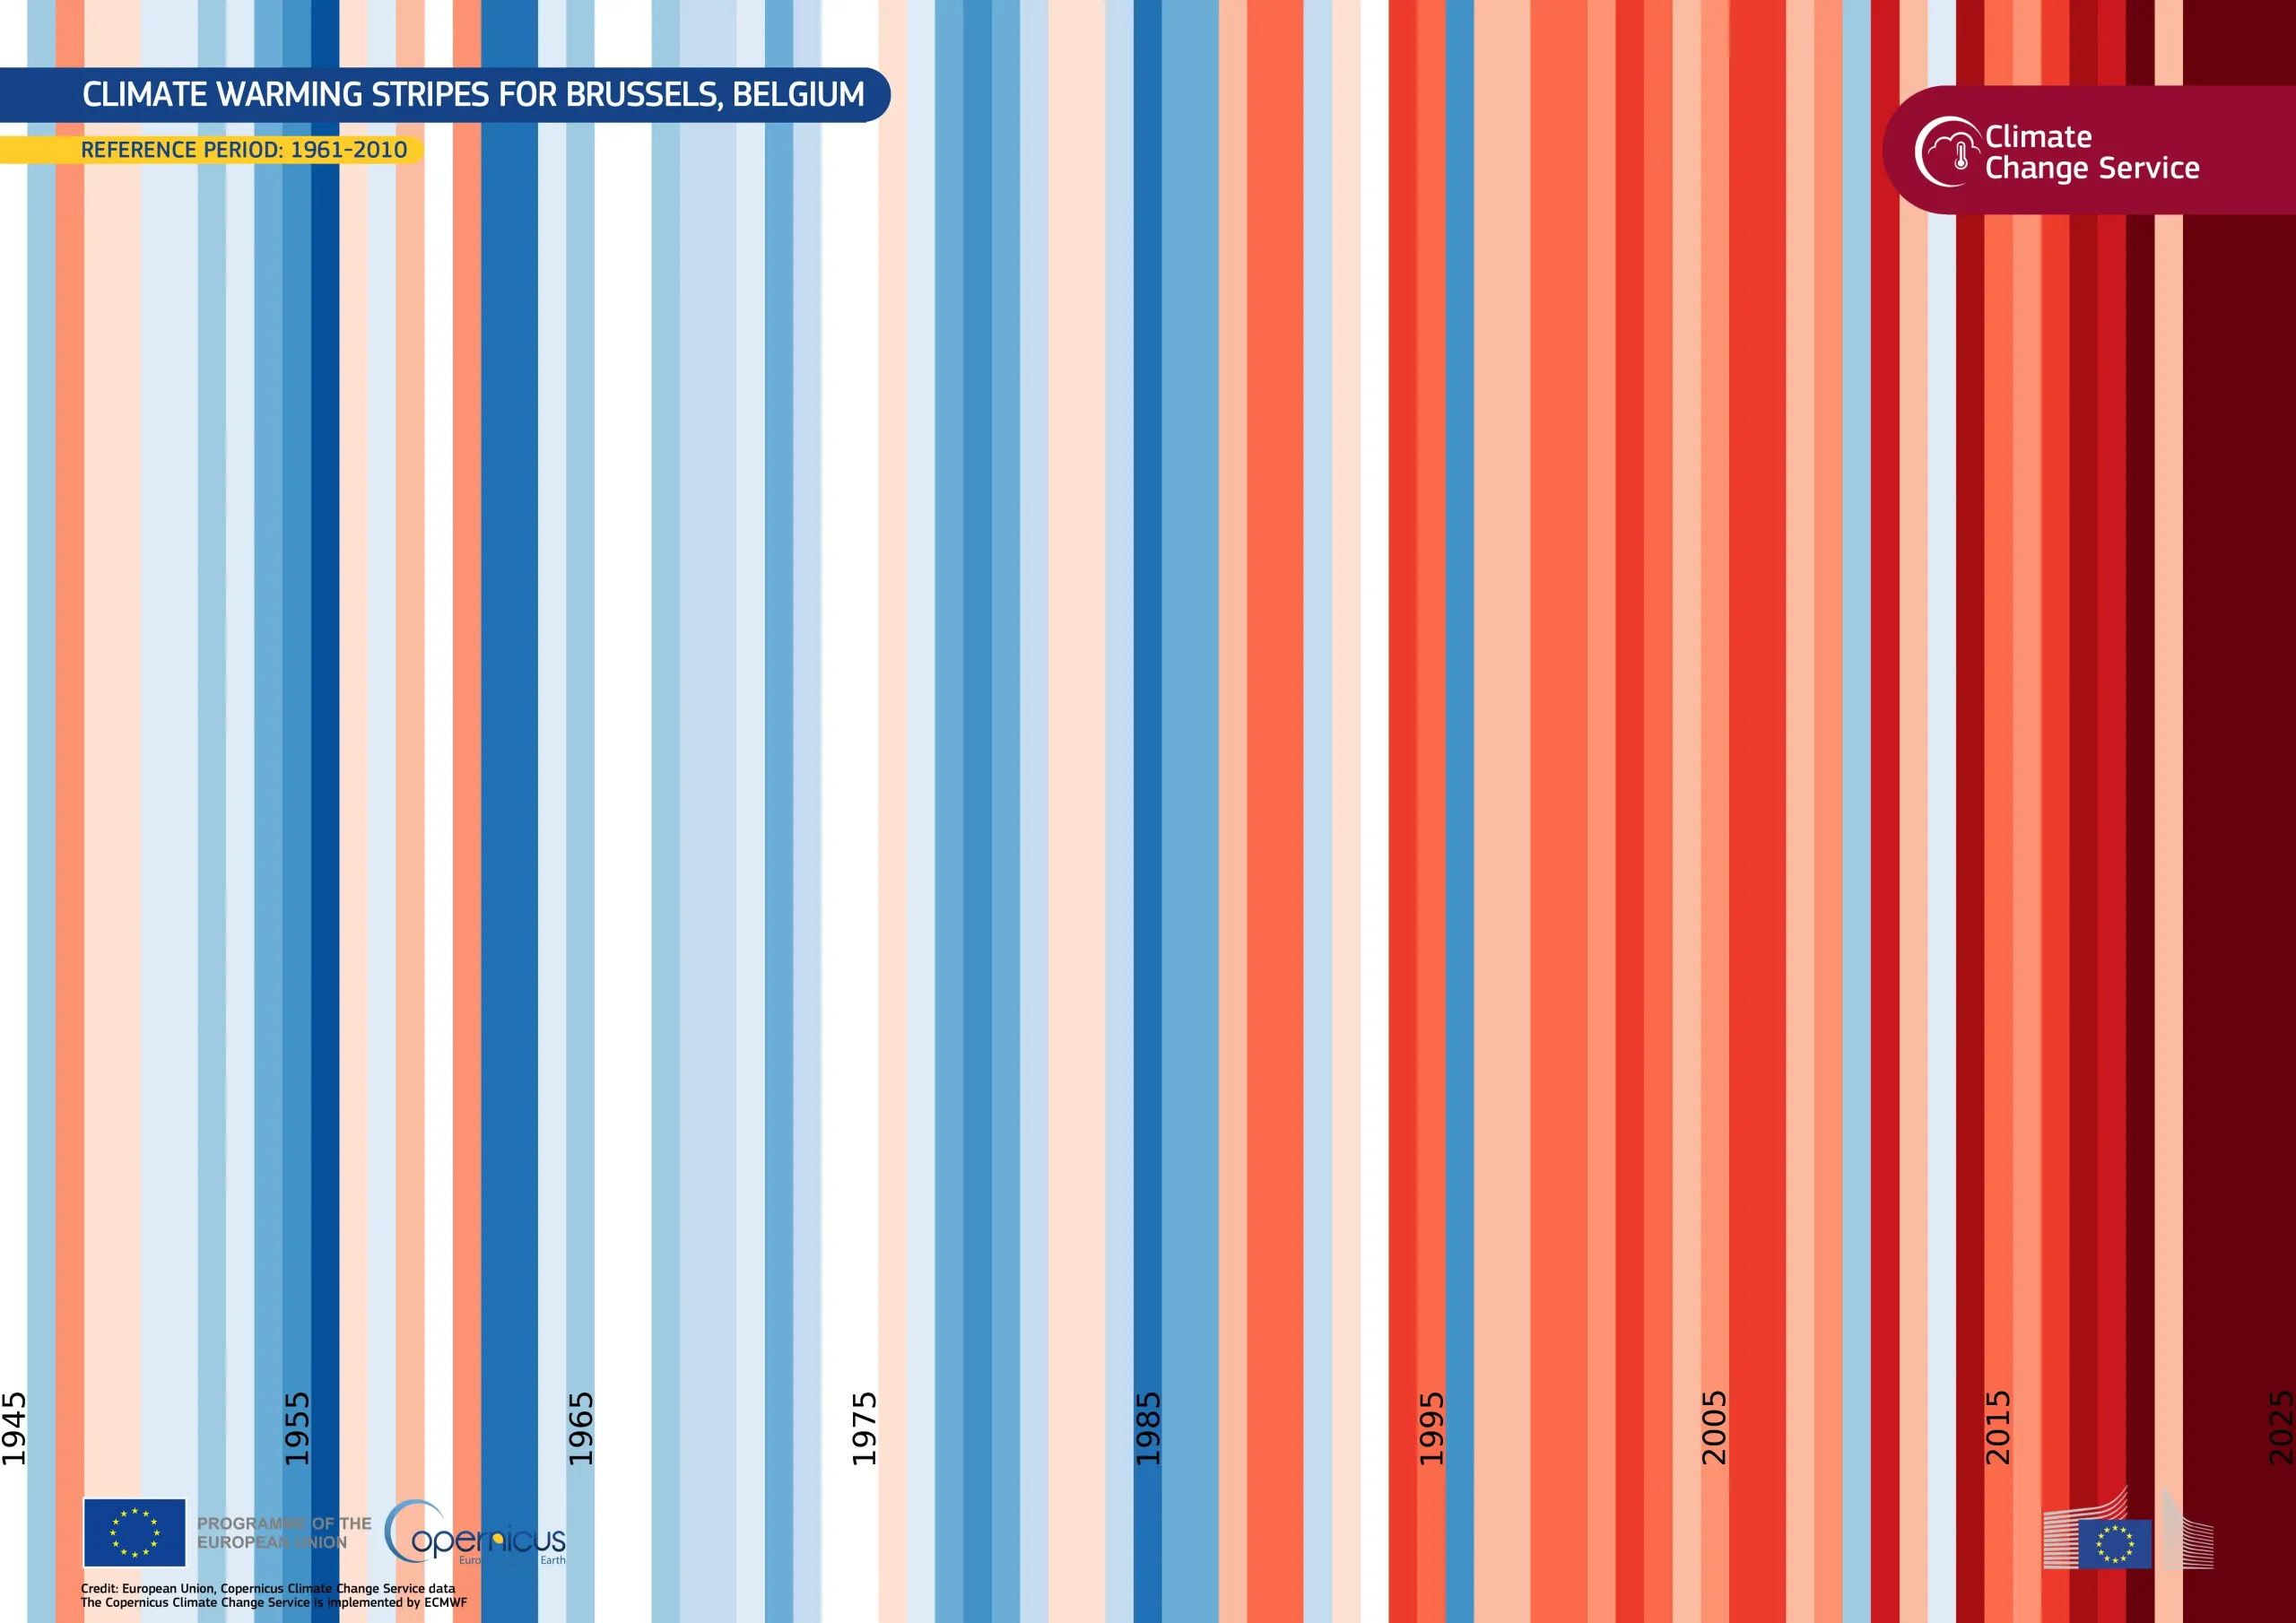
Show Your Stripes Day, celebrated every year around 21 June, is an initiative to raise awareness of climate change and the need for urgent action. “Climate stripes” are a simple but impactful visual rendering of global warming. Each vertical stripe represents one year’s average temperature at a given location. Blue stripes indicate years which were cooler than the reference period, while red stripes indicate warmer years.
This data visualisation, based on Copernicus Climate Change Service (C3S) ERA-5 data, shows average annual temperature anomalies for Brussels, Belgium, from 1945 to 2025 vis-à-vis the 1961-2010 reference period. The progression from predominantly blue tones in earlier decades to increasingly red tones in recent years reflects the long-term rise in average temperatures recorded in the Belgian capital.
C3S provides authoritative climate data and tools which support the monitoring of temperature trends at global, regional, and local scales. These datasets help public authorities, researchers, and citizens better understand climate variability and long-term change, and support evidence-based planning and climate adaptation.
![Download [WEBP, 130.84 KB]](https://eu-space.europa.eu/sites/default/files/2026-06/20260621_Warming%20stripes%20day%202026.webp)